Case study — Travel Planning · Dashboard
Wanderlust
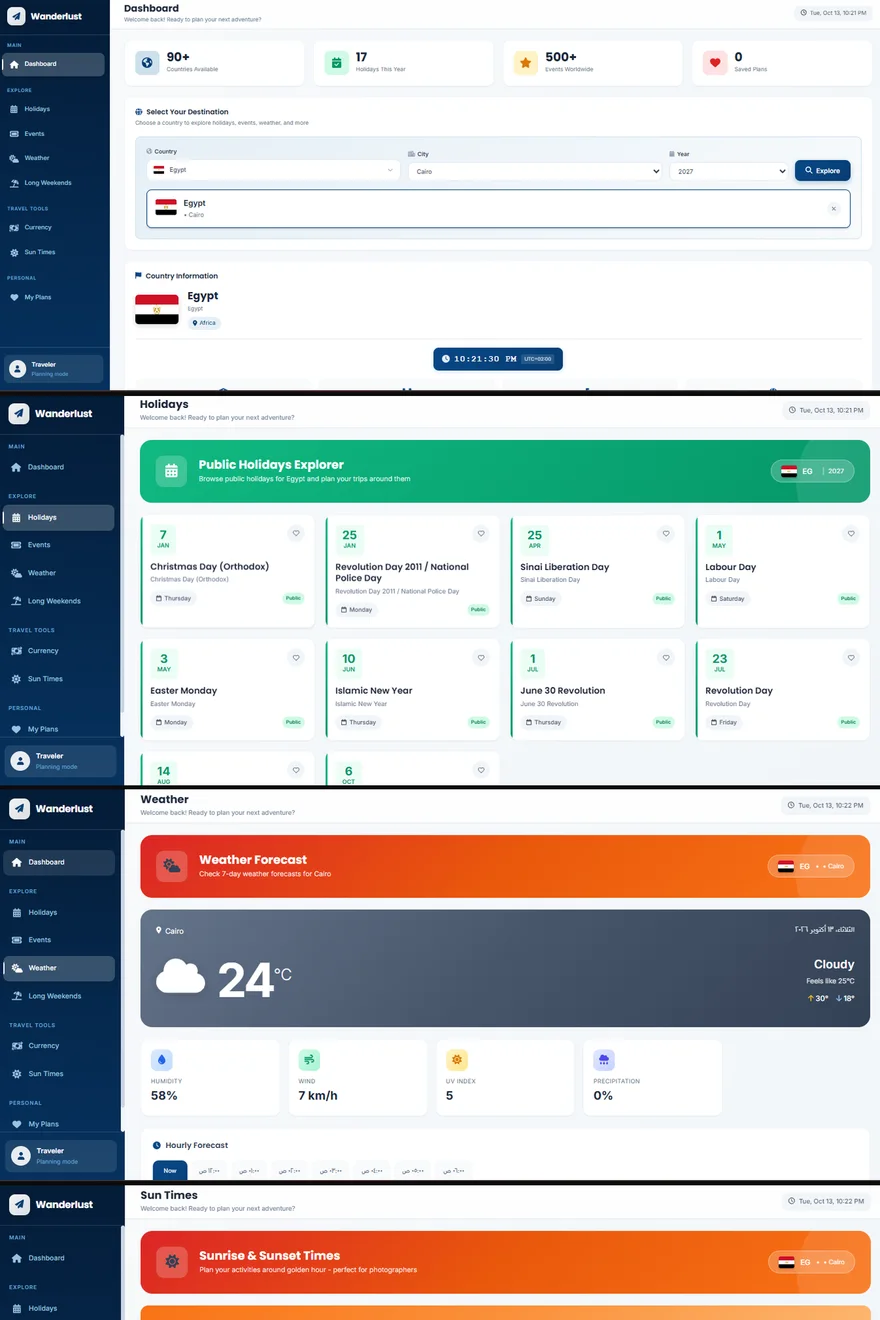
Wanderlust is a travel-planning dashboard. Choose a country, a city and a year, and it gathers everything you'd want before booking: public holidays, long weekends, local events, a 7-day weather forecast, exchange rates and sunrise and sunset times — and lets you save the plans you like.
- Role
- Front-End Developer
- Year
- 2026
- Context
- Course exam project
- Services
- API Integration · Dashboard · Saved Plans
- Stack
- JavaScript · HTML5 · CSS3 · 5 Public APIs · LocalStorage
Live build — hover to pan
01
The Challenge
Planning a trip usually means opening a dozen tabs: one for holidays, one for the weather, one for events, another for the currency. The information exists, but it's scattered and presented in very different ways.
The goal was one calm, consistent dashboard that brings it all together for any country — built in plain JavaScript, without a framework.
02
The Approach
Organise the app the way a framework would, even without one: a central state, one service for all API calls, a view manager for navigation, and one controller per screen.
Make the destination the single source of truth: pick it once on the dashboard, and every view — holidays, events, weather, long weekends, currency, sun times — follows that choice.
03
The Design
A fixed sidebar groups eight views into Main, Explore, Travel Tools and Personal. Each view opens with a coloured banner showing the selected country's flag and city, followed by cards built for that kind of data.
The styles are split into separate, purpose-named files — base, layout, components, views, widgets, dashboard and weather — so a change to one part of the interface can't accidentally break another.
04
The Development
Around four thousand lines of modern JavaScript organised into classes: AppState, ApiService, ViewManager with hash-based routing, UIComponents for toasts, modals and loaders, and a controller for each view.
Five public APIs are combined: REST Countries, Nager.Date (holidays and long weekends), Open-Meteo (weather), ExchangeRate API and Sunrise-Sunset. Events are wired for the Ticketmaster Discovery API and fall back to generated sample events when no API key is set, and responses are cached so revisiting a view doesn't refetch. Saved plans and the last selection persist in LocalStorage.
Thoughtful details: temperatures switch to Fahrenheit for countries that use it, dates are formatted in each country's own locale, banner colours follow the region, and the country picker is searchable.
05
The Hardest Part
The hardest part was keeping a large stylesheet and many widgets from colliding. With dozens of cards, banners and widgets across eight views, a rule written for one screen could easily change another.
The solution was an architecture of separate CSS files with clear, scoped class names — weather styles only in weather.css, widgets only in widgets.css — matched by the same separation in JavaScript, where each view's controller owns only its own part of the page.
06
The Performance
Views only request their data when you open them, and each one shows a loading state while it waits and a clear message if a service is unavailable, so a slow API never freezes the whole dashboard.
07
The Result
A dashboard that turns a dozen open tabs into one place to plan a trip. It is live on GitHub Pages.
Services behind this project
Next Step
Have an idea worth building?
Let's turn it into an interface people remember — fast, responsive and built to last.
Usually replies within a day · Gaza, Palestine · working remotely worldwide
View my work